Identifying sustainability ‘hotspots’
Our commitment: Assess and optimise the environmental performance of our products

Improving the environmental impact of our foods and beverages
We assess and optimise the environmental performance of our new and renovated products across the entire value chain, from farmer to consumer and beyond. This gives us a clear understanding of their life-cycle impacts.
Progress against our objectives
| Our objectives | Our results |
|
By 2020: Identify, update and address the sustainability ‘hotspots’ for 20 product categories. |
By the end of 2017 we assessed and addressed the sustainability hotspots for 22 product categories. By the end of 2017, we evaluated 7005 projects and 20 608 scenarios using eco-design tools, since the introduction of eco-design software a decade ago. |
We are proud of our product quality and believe that it is strongly linked to respect for the environment. To evaluate the total environmental footprint of a product, we apply a life-cycle assessment (LCA) approach. In the case of Nescafé, this looks at the full life-cycle from plantlet to end of life, and assesses the environmental performance of all our activities across the value chain.

Carbon footprint
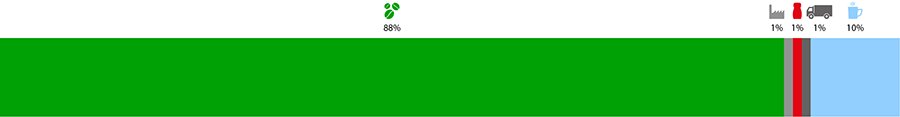
The carbon footprint represents the quantity of greenhouse gases (GHGs) generated along the coffee value chain that influence global warming. The carbon footprint is expressed in kg CO2 equivalent and measures GHG emissions over the entire life-cycle of a cup of coffee.
 Click to enlarge
The largest contribution to the carbon footprint of a cup of Nescafé comes from growing coffee through the production and application of agrochemicals, and from deforestation. The second largest aspect is the consumer use stage, which is dominated by the energy used through cup washing, beverage preparation and any extra water boiled.
Water footprint
Water resource depletion (also known as water scarcity footprint) is a measure of water consumed from natural systems, considering whether the region is under stress due to lack of freshwater. The water footprint is measured in cubic metres of water equivalent.
 Click to enlarge
The irrigation of coffee trees is the biggest driver of water resource depletion associated with a cup of Nescafé. Other contributors to water resource depletion include the water used to make a cup of coffee, any extra water boiled and the washing up of the coffee cup and equipment.
Land use
The use of land for agriculture and infrastructure reduces the quantity and quality of the natural environment. Soil loss is related to use and conversion by activities such as agriculture, roads and housing.
 Click to enlarge
The impact on land use of a cup of Nescafé is dominated by the agricultural land used for coffee cultivation.


